
Landing pages: a crucial part of any marketing strategy. We ideate, design, and publish them all the time to get on top of Google search results, but then what? What impact do they have on our search engine optimization (SEO), and what do we even do with that information?
Then there’s Google Analytics 4 (GA4), which is fundamental in understanding:
- how many visitors find you each day,
- the value of specific site content,
- how a particular page is performing,
- your overall website traffic, and
- way, way more.
Landing page reports are the secret sauce to your marketing efforts, and they're not as complicated as they might seem. So let's get into it and learn what they are and why they're so very vital, especially when using Google Analytics 4.
Table of Contents
What are landing page reports?
Imagine you’re about to start a huge party, and the landing page is the front door. You'd want to know who's coming in, right? Landing page reports are like the friendly doorman, keeping track of everyone who enters and leaves.

In technical terms, a landing page report is a collection of data about the first page visitors land on when they come to your website. It tells you things like how many people arrived, where they came from, and what they did once they got there. Think of it like having a bird's-eye view of your party guests' first impressions.
Why use Google Analytics 4 for landing page reports?
Now, why would you want to gather these metrics using Google Analytics 4? Well, GA4 is like the party planner's toolkit. It's got everything you need to make sure your guests (or website visitors) are having a blast.
Understanding Your Audience
By tracking landing page metrics, you can see what's resonating with your visitors. Are they dancing to the music or heading straight for the snacks? In other words, what content is engaging them?
Improving Performance
If you notice that people are leaving your party too quickly, you can figure out why. Maybe the music's too loud, or the snacks are all wrong. With Google Analytics, you can identify issues on your landing pages and make improvements.
Measuring Success
Do you want to know if your new party theme (or marketing campaign) is a hit? Google Analytics 4 will tell you how well your landing pages are performing, so you can celebrate the wins and adjust what's not working.
And here's the kicker – it's not as hard as it seems. Google Analytics 4 has user-friendly tools to create and analyze landing page reports. You don't need to be a tech wizard to get valuable insights.

But if you do need some technical assistance with a unique need or concern, (custom dashboard creation, e-commerce tracking, or anything else) you can always book a meeting with me!
So, don't let the fear of the unknown keep you from the party. Embrace landing page reports with Google Analytics 4. After all, understanding your visitors is the key to creating something that captures your uniqueness.
Now, who's ready to dance with their landing page guests? 🎉

What is a landing page in Google Analytics 4?
Contrary to our usual understanding of what defines a landing page, in the Google Analytics world it can be any of the following:
- your homepage,
- a (marketing) page tied to a given campaign,
- a blog post,
- and even an error 404 page.
This might come as a surprise to many marketers and managers who often think of landing pages as specific pages designed for marketing campaigns. But in Google Analytics 4, a landing page is essentially any page where a visitor enters your website.
This broad definition opens up a world of possibilities and insights.
For instance, your homepage is often the virtual 'front door' of your website. Knowing how many people enter here can give you insights into the effectiveness of your branding and general search visibility.
If a significant portion of your traffic lands on the homepage, it might indicate that your brand name is strong and easily recognizable.
Marketing landing pages are usually the ones we're most familiar with. These are designed to drive specific actions, like signing up for a newsletter or making a purchase. Tracking such pages can give you direct insights into the ROI of your marketing campaigns.

Blog posts as landing pages can be particularly revealing, too. If a particular post is attracting a lot of initial visits, it's likely resonating with your audience or ranking well in engines. This could be a cue to produce more content around similar topics or to consider optimizing that post to convert readers into customers (Mythic can help with that, too).
And let's not forget the dreaded 404 error page. If this is one of your top landing pages, it's a red flag that needs immediate attention. It means people are being directed to a page that doesn't exist, which is a missed opportunity and a poor user experience.
So, when you're looking at your Landing Pages Report in Google Analytics 4, remember that it's not just about those specially crafted marketing pages. It's a high-level view of how people are entering your digital space.

Each type of landing page offers its own set of insights and opportunities for optimization, making it a rich resource for anyone keen on improving website performance and user experience.
No longer will you need to ask yourself, “what is a landing page in Google Analytics 4?”
You’re welcome 😉
What are landing page views in Google Analytics 4?
Before the party we need to know what the doorman’s entrance is all about, right? How are they counting those who come in, tracking their dress code metrics, noting the length of stay inside, etc?
With Google Analytics landing pages, "Landing Page Views" might sound like just another buzzword, but it's actually a super useful metric that describes the door. When someone clicks on a link to your website, the first page they "land" on is recorded as a Landing Page View.
But why does this matter? First impressions are everything. Landing Page Views give you a snapshot of how effective that initial page is at drawing people in.
It's like knowing how many people actually showed up to your party versus the number who just said they would. Multiple pages could be doing this for your site, opening up additional possibilities for user engagement.
Landing page tracking is especially important if you're running paid campaigns. You want to know that your investment is leading people to truly engage with your site, not just click and bounce. What are your most popular landing pages, and how can you optimize them?
Landing Page Views are easy to find and analyze in GA4. It's all laid out in a user-friendly dashboard, allowing you to see which pages are (hopefully) ranking on the first page in search results, and which might still need a little love.
In a nutshell, Landing Page Views are your go-to metric for understanding where a user lands. They help to see if your landing pages are doing their job: capturing attention and enticing visitors to explore more.
Like the first song you play at your party if the music is good, people will stick around for the rest of the night.
What are the key metrics in a landing pages report?
Here are some crucial landing page data metrics you should definitely keep an eye on.
Sessions
This is the number of visits to your landing page. More sessions generally mean greater opportunities for engagement, and more new users.
Bounce Rate
Imagine inviting someone to your party and then they leave without saying a word—that's a "bounce."
A high bounce rate could mean that visitors aren't finding what they expected, so you might need to make some changes to your content and/or design. You can use a specified date range, if needed. A Google Analytics 4 landing page report can tell you who not to invite again.
Average Session Duration
This data tells you how long people are staying on your landing page. If they're sticking around to read, watch, or interact, you're probably doing something right! You can look at this over a specified time period as well, in case there’s a big event or news that impacts your traffic (more on this below).
Conversion Rate
The golden goose of landing page metrics. This shows the percentage of visitors who took a desired action, like signing up for a newsletter or making a purchase. You can define a conversion event in different ways, according to the specifics of your business.

Page Value
This metric helps you understand the financial value of your landing page in relation to other pages. It's like knowing which product in your store is the best seller.
Traffic Source
Knowing where your visitors are coming from (search engines, social media, direct links, etc.) can help you tailor your marketing strategies to various audiences across platforms.
New vs. Returning Visitors
This metric gives you a sense of your audience's loyalty. Are they first-timers, or are they coming back because they love what you offer?
Understanding these key metrics can give you a comprehensive view of how well your landing page is performing. The landing page report is that doorman who truly watches everything for you. Who doesn’t want to know about new users, how many pageviews are happening, referral traffic, etc?
So go ahead, dig into these metrics and let the data guide you toward further awesomeness. The more you know, the more you can fine-tune your strategy to truly stand out. 🌟
Use Google's pre-made landing pages report
The simplest place to start is often the best. If you haven’t already, take a look at the pre-made Google Analytics landing page report.
- Navigate to: https://analytics.google.com
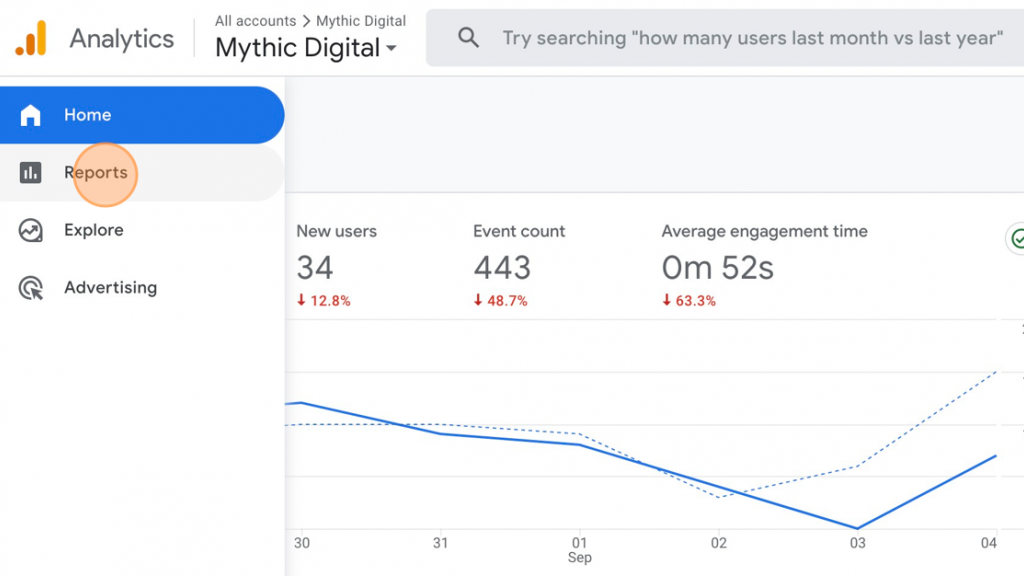
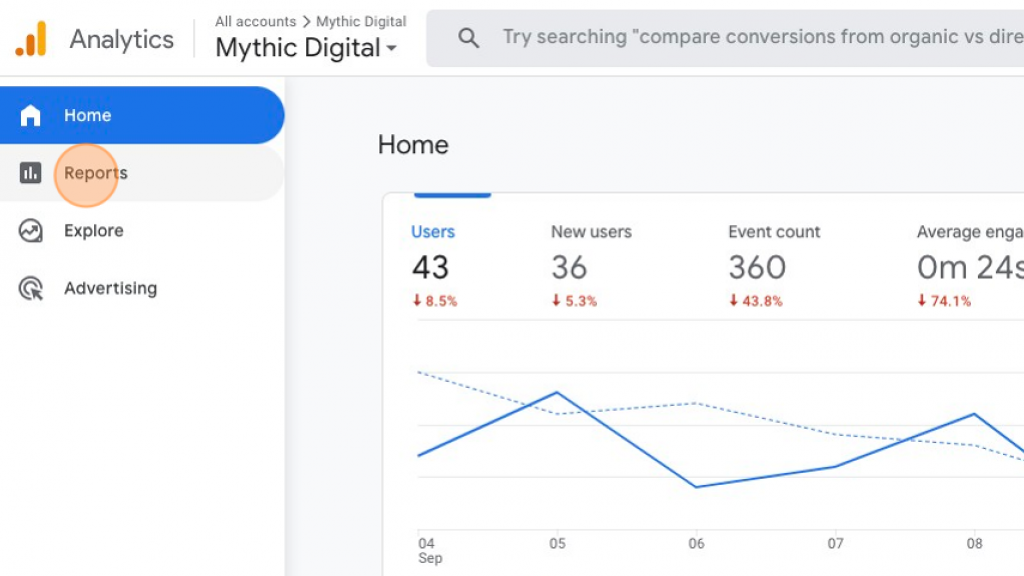
- Click on “Reports” in the left navigation.
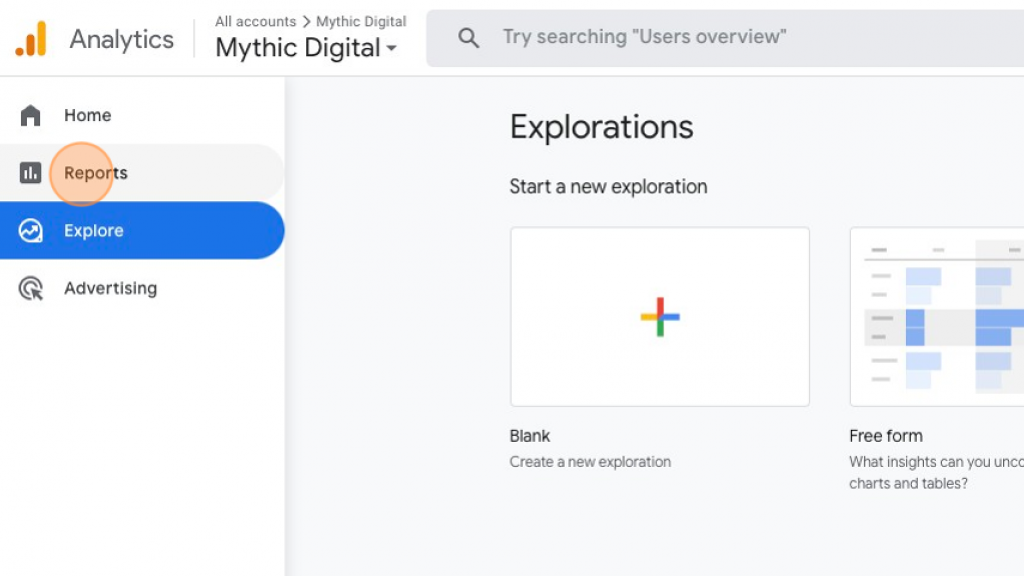
- Click “Engagement.”
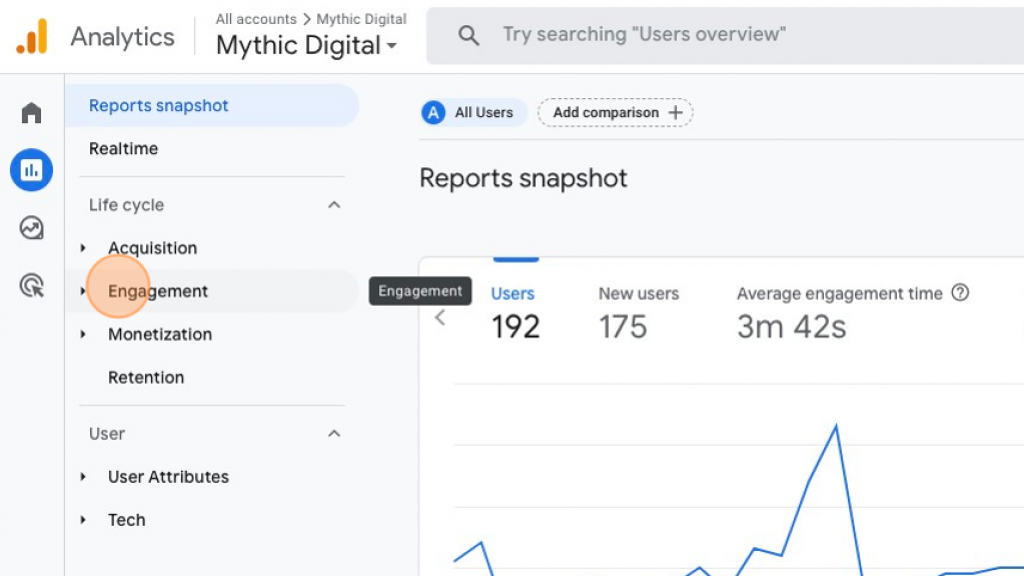
- Click “Landing page.”
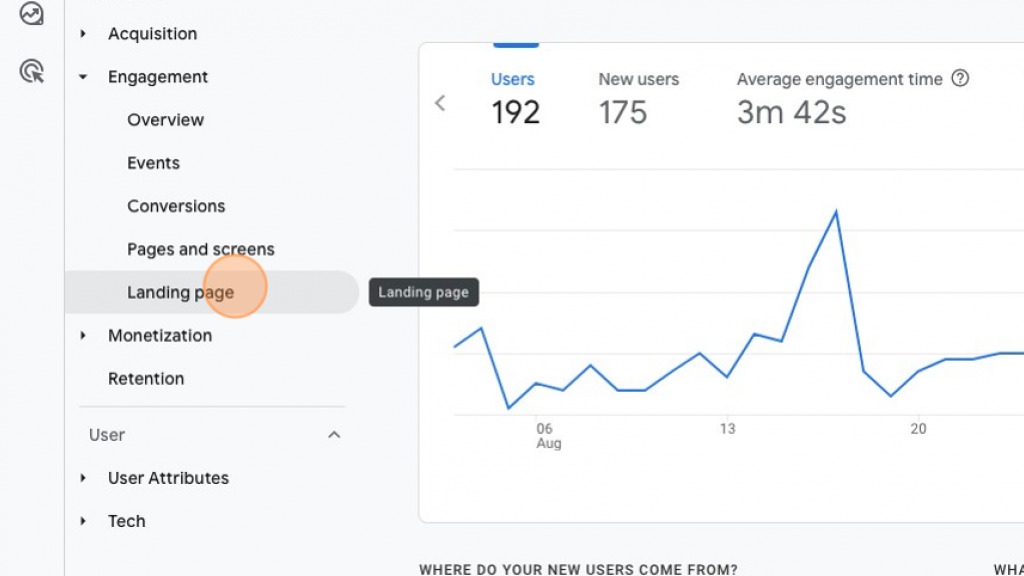
The native, or pre-made landing page report that Google Analytics 4 creates by default will look something like this:
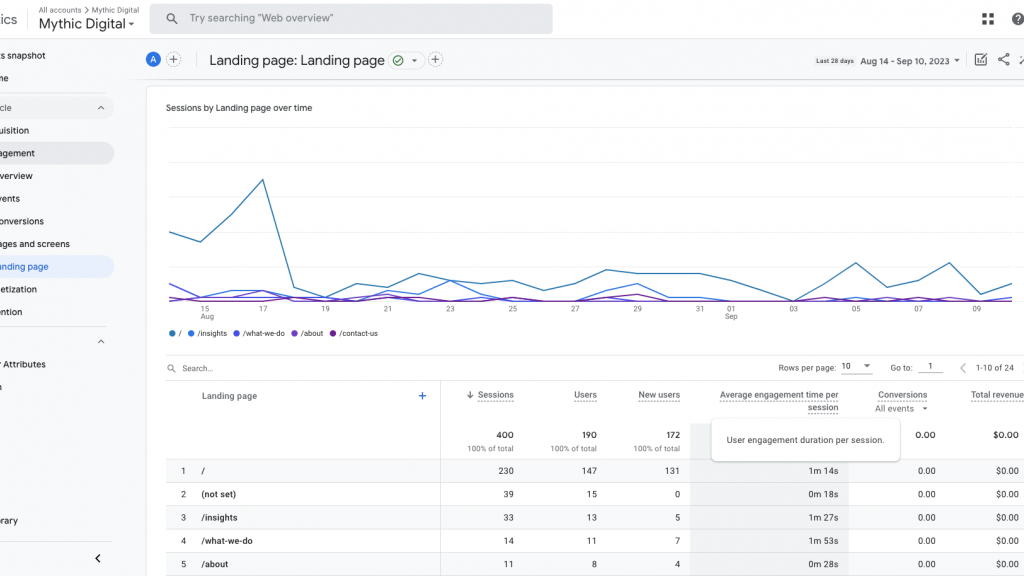
Now, what about generating a landing page report that's more tailored to your specific needs?
How to create a custom landing pages report
This is where you can add and remove a landing page dimension, tailor your data visualization, and more.
1. Navigate to: https://analytics.google.com
2. Click "Reports" in the left navigation.

3. Click, "Engagement."
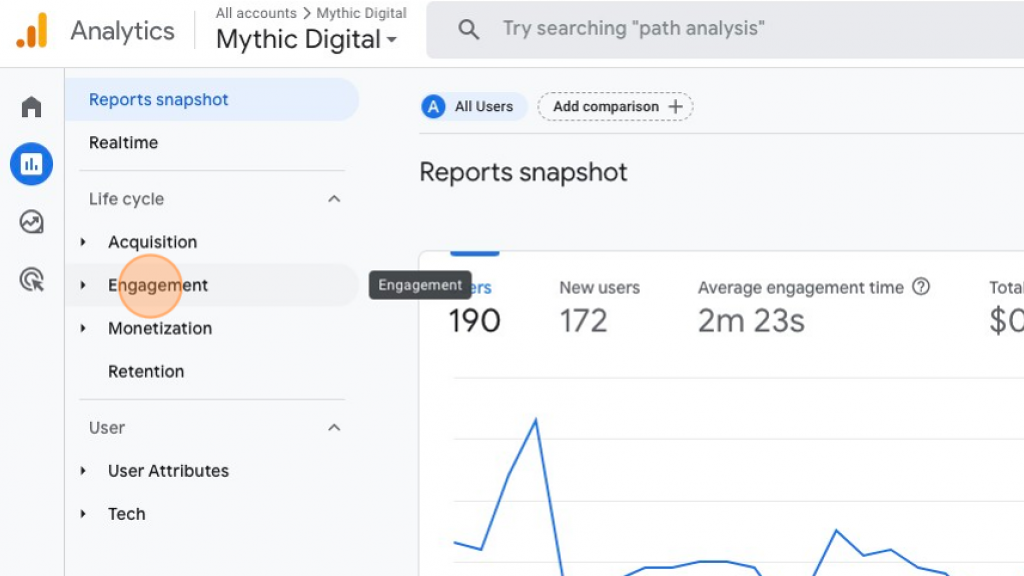
4. Choose "Pages and screens."
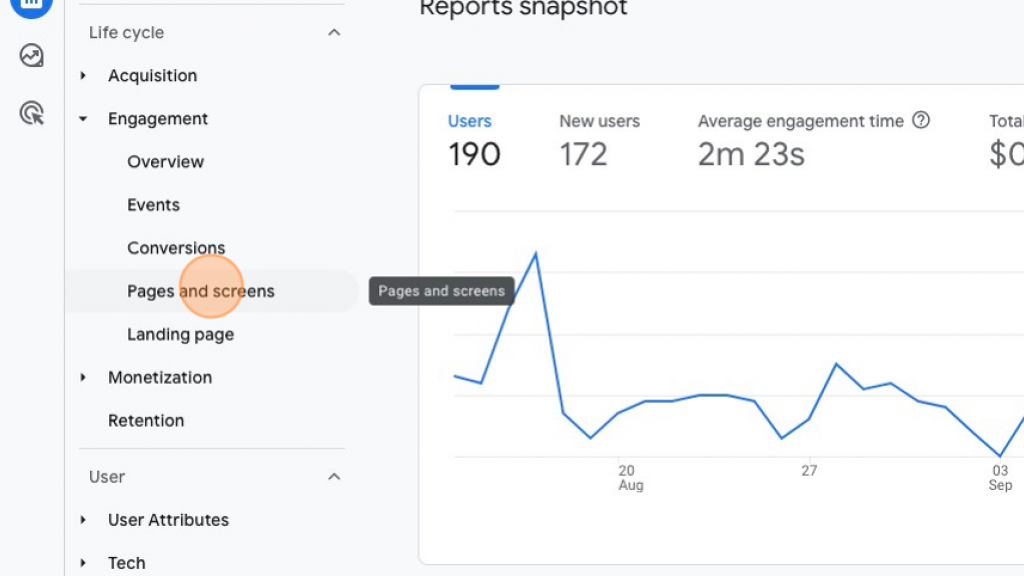
5. Find the pencil icon to customize the report.
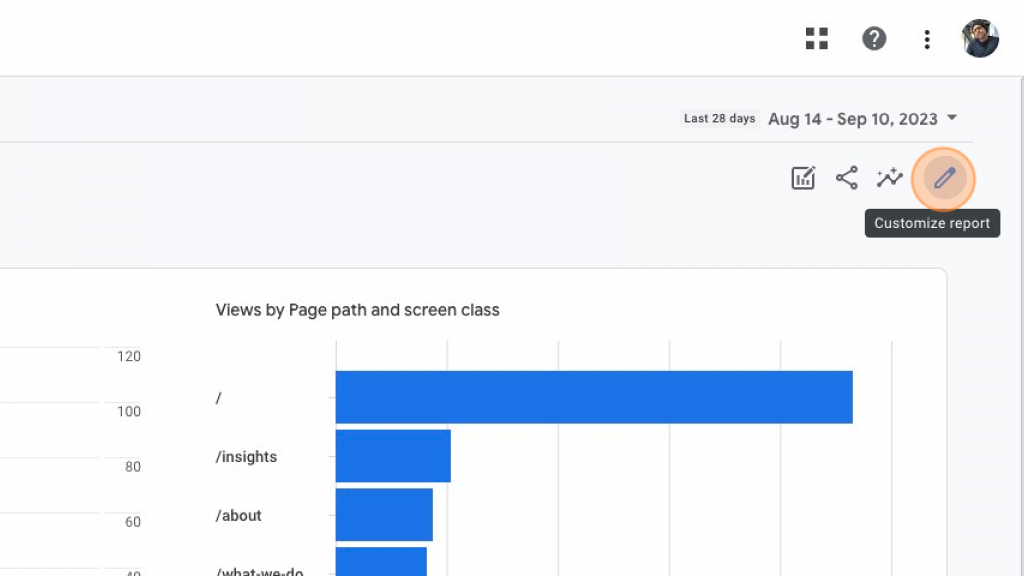
6. Click "Dimensions."
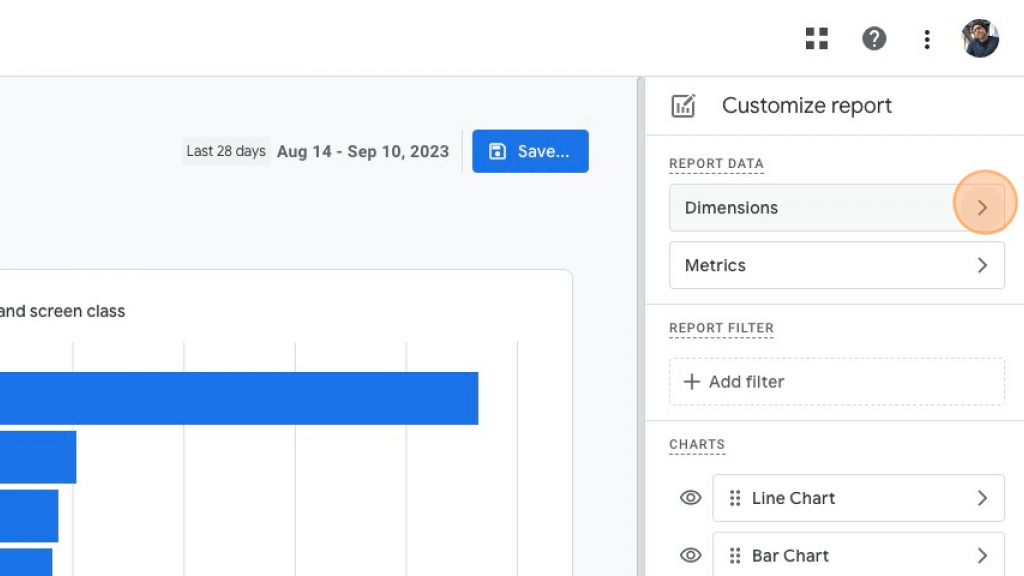
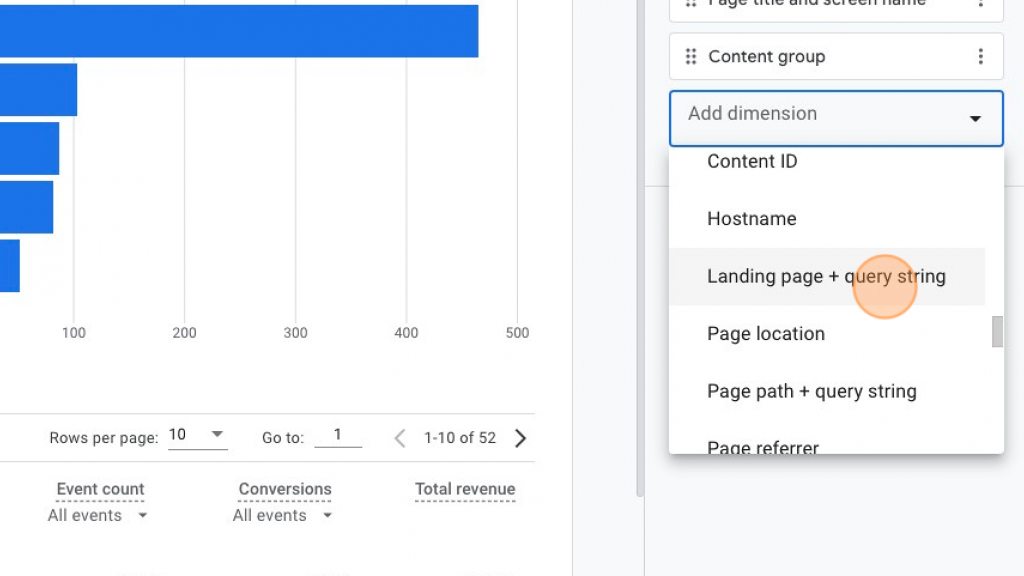
7. Click the "Add dimension" field.
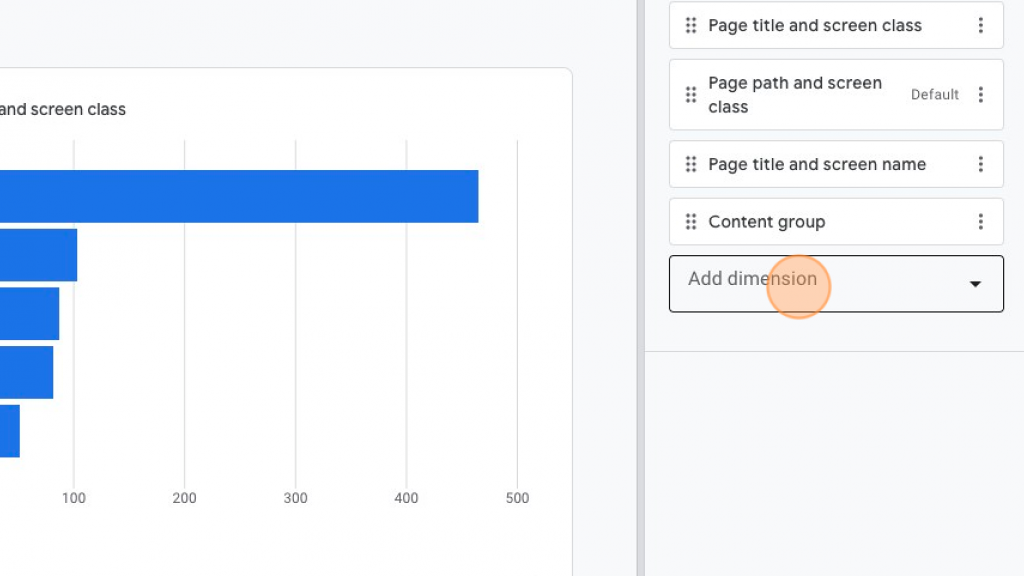
8. Choose "Landing page + query string" from the dropdown menu.
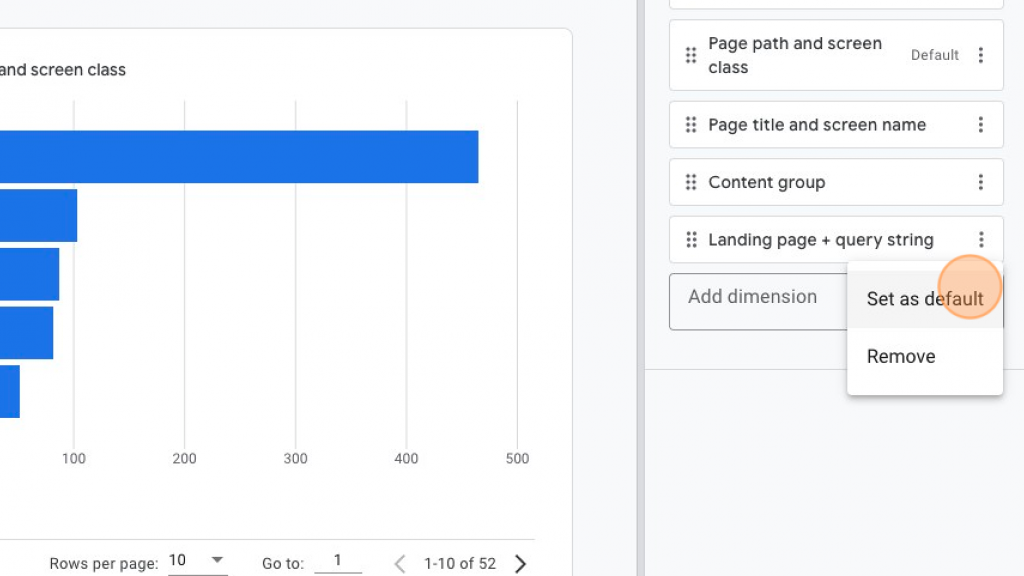
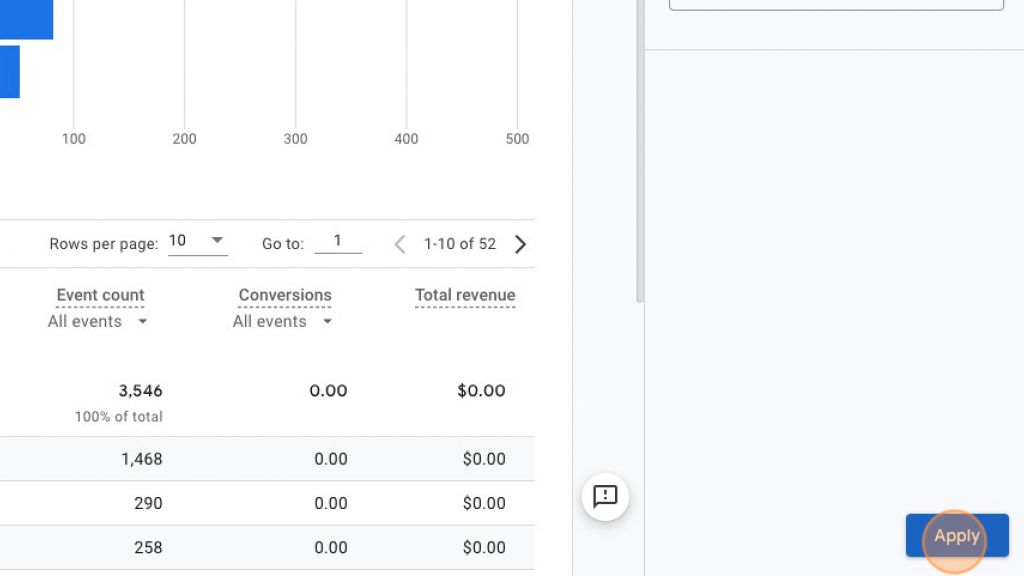
9. Click the 3 vertical dots to set this dimension as the default.
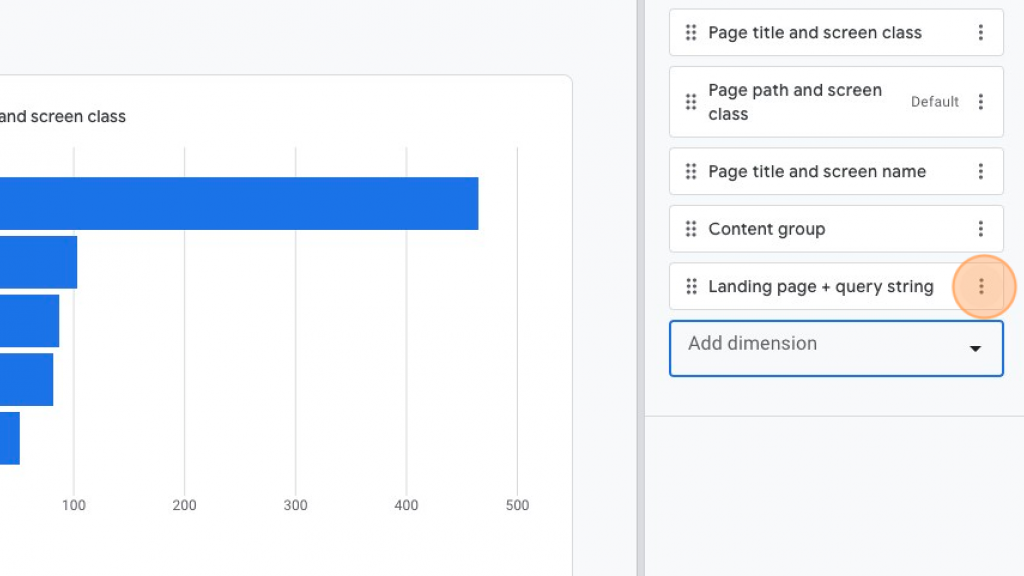
10. Click "Set as default."
11. Click "Apply."
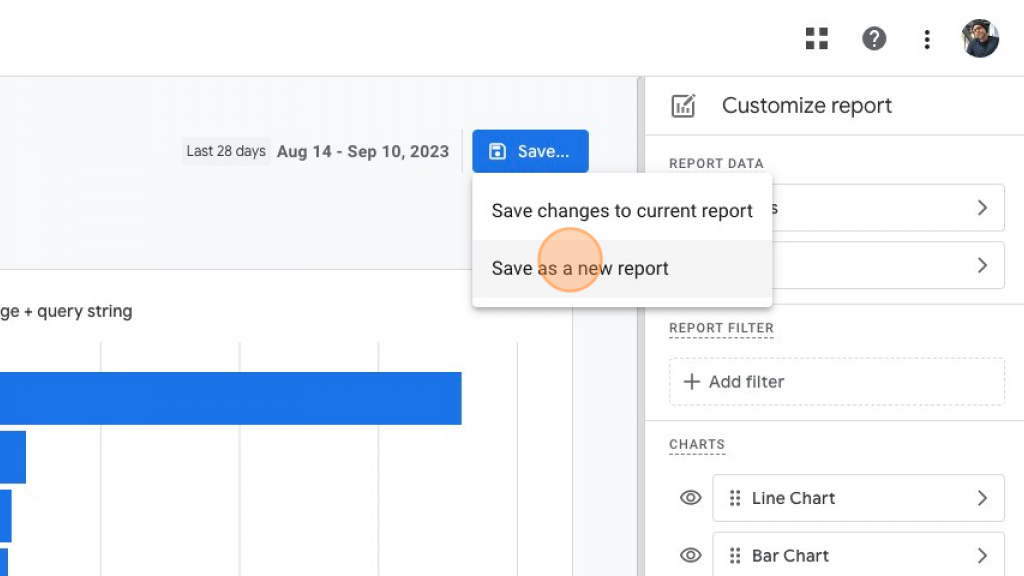
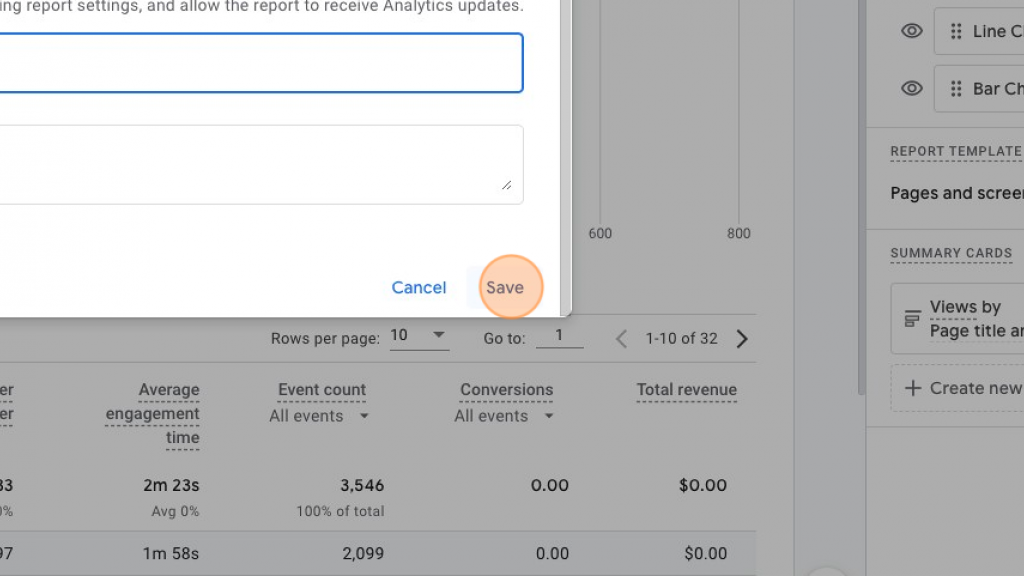
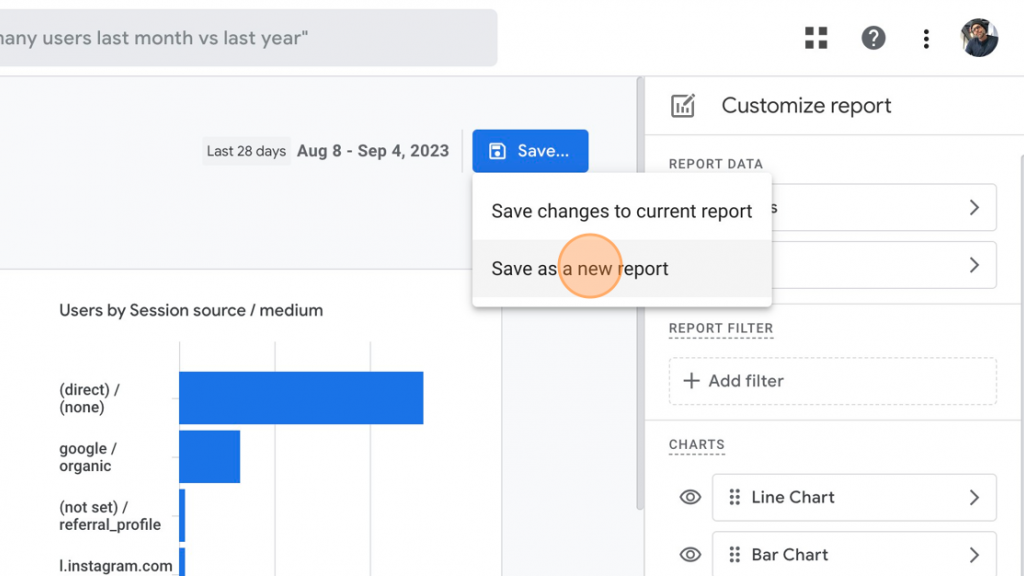
12. Click the blue floppy disk icon: "Save."
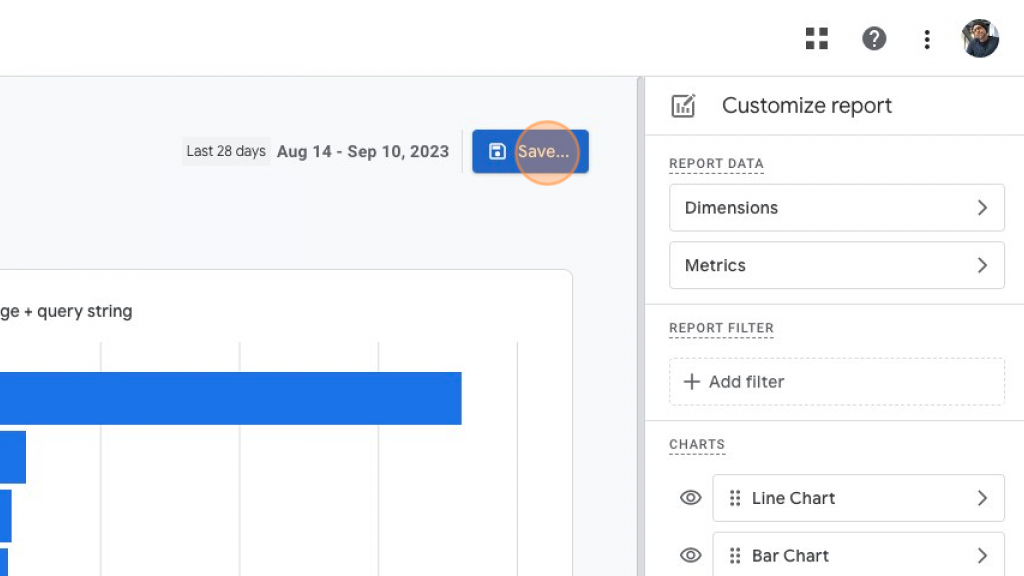
13. Choose "Save as a new report."
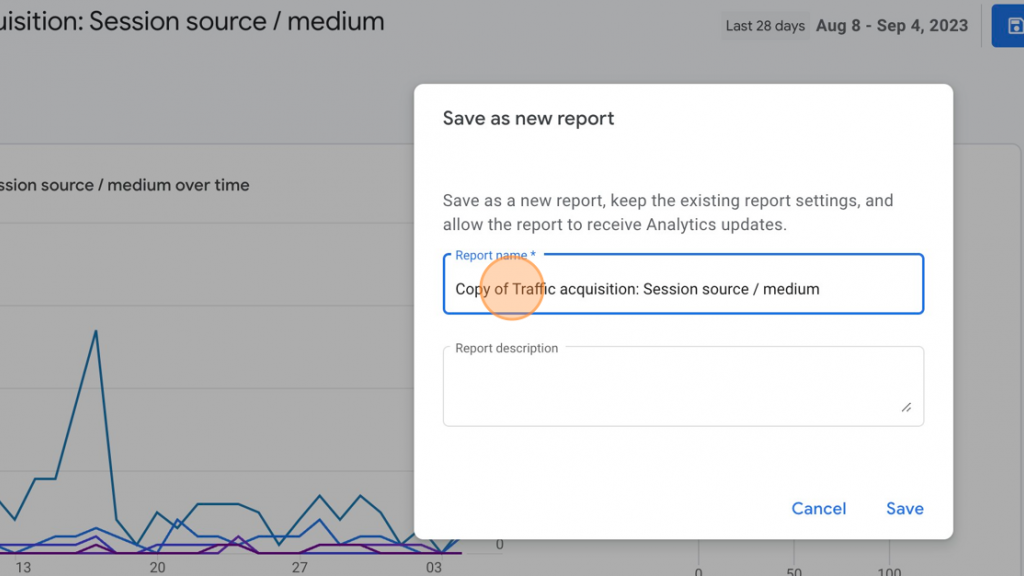
14. Give the report a name. Make it one that will be easily recognizable in the Left Navigation (i.e. "Landing Pages" or use the specific page's name).
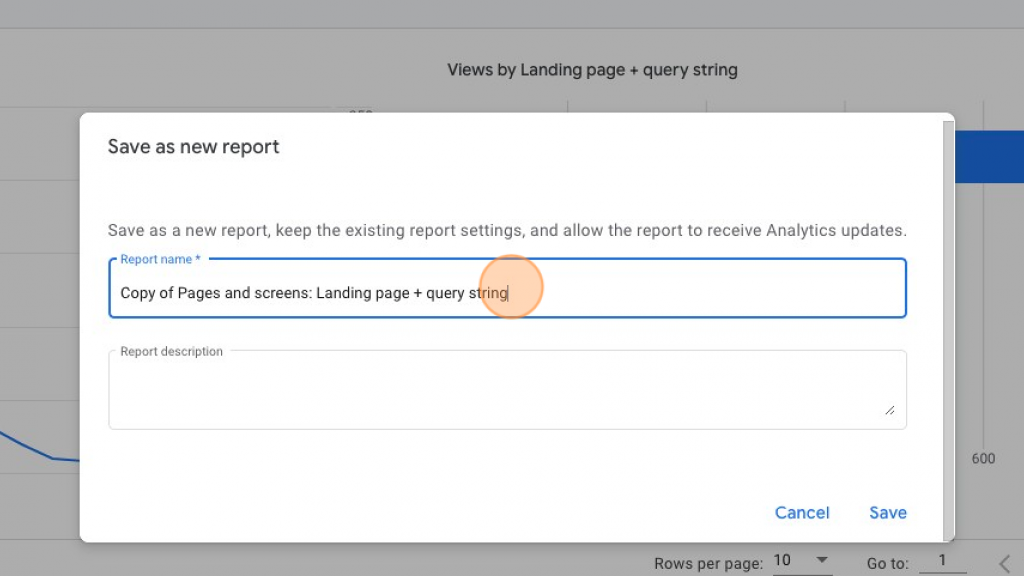
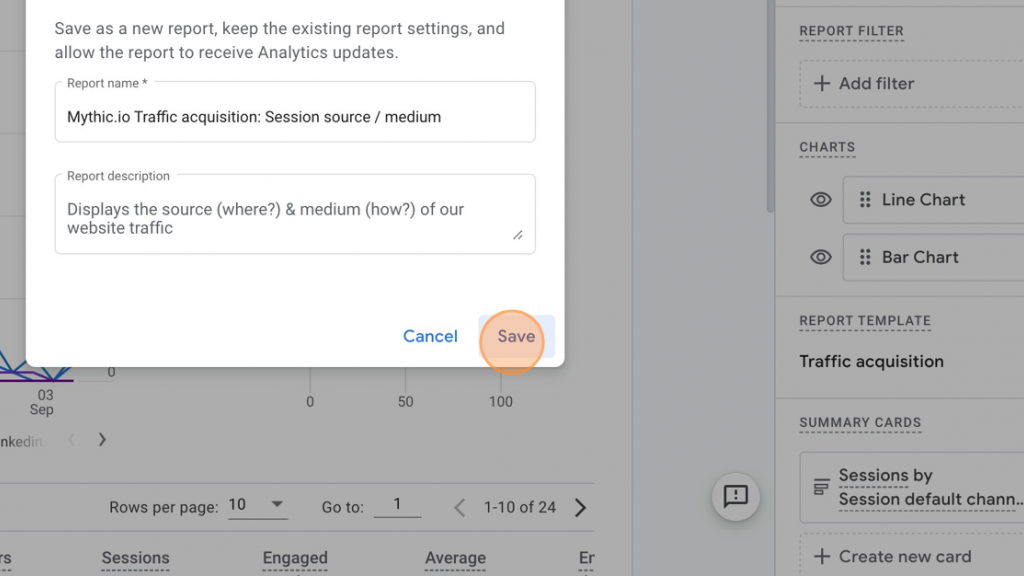
15. Click "Save."
We want to be able to see this new custom landing page report in the Left Navigation from the "Reports" page.
16. Navigate back to "Reports" and look for the folder icon and "Library" link, bottom left.
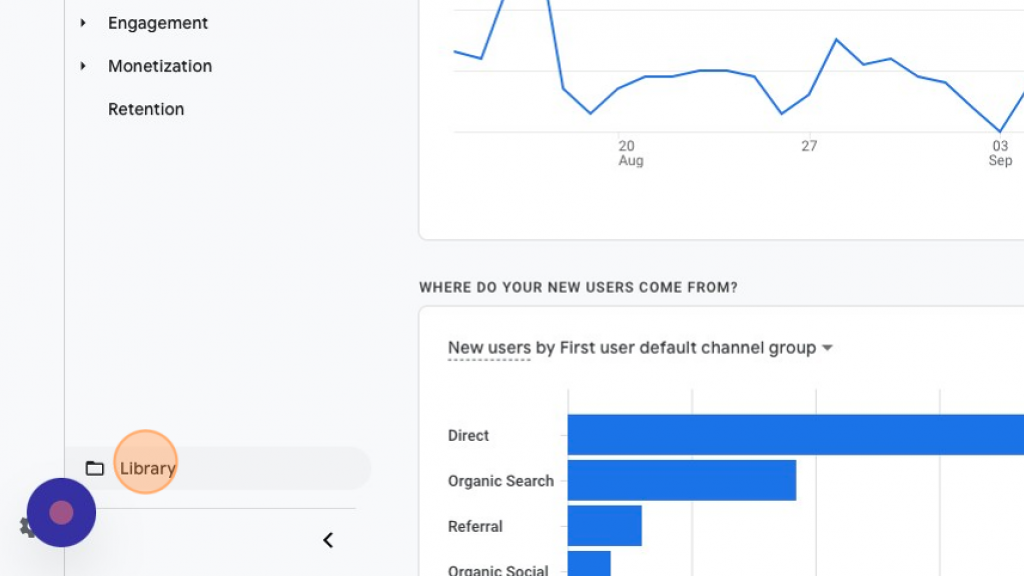
17. Fine the "Life cycle" collection and click "Edit Collection."
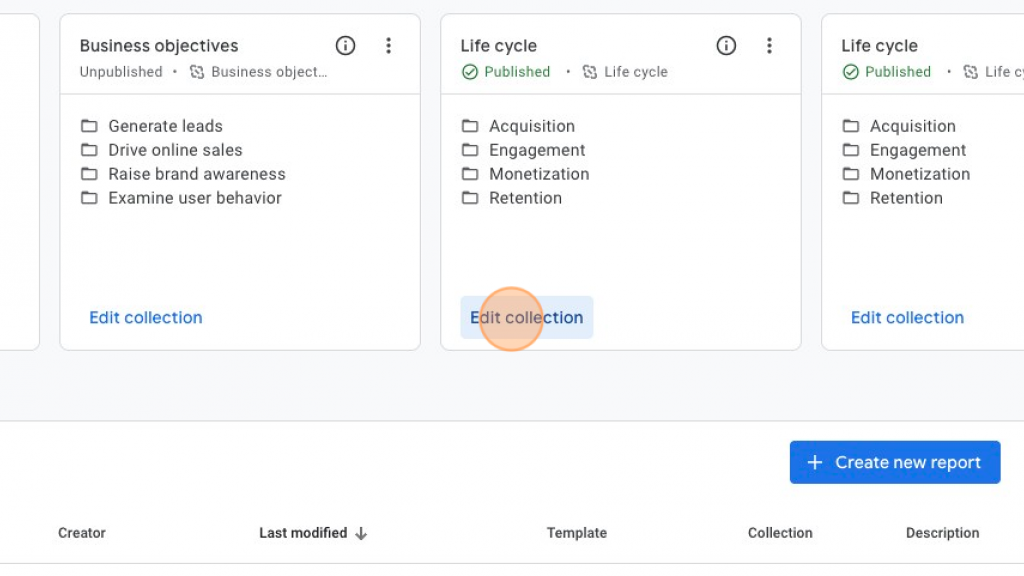
18. For simplicity, I named my custom report "Landing Pages". From here, drag the new report into the Life cycle collection desired. Ours will live in "Acquisition."
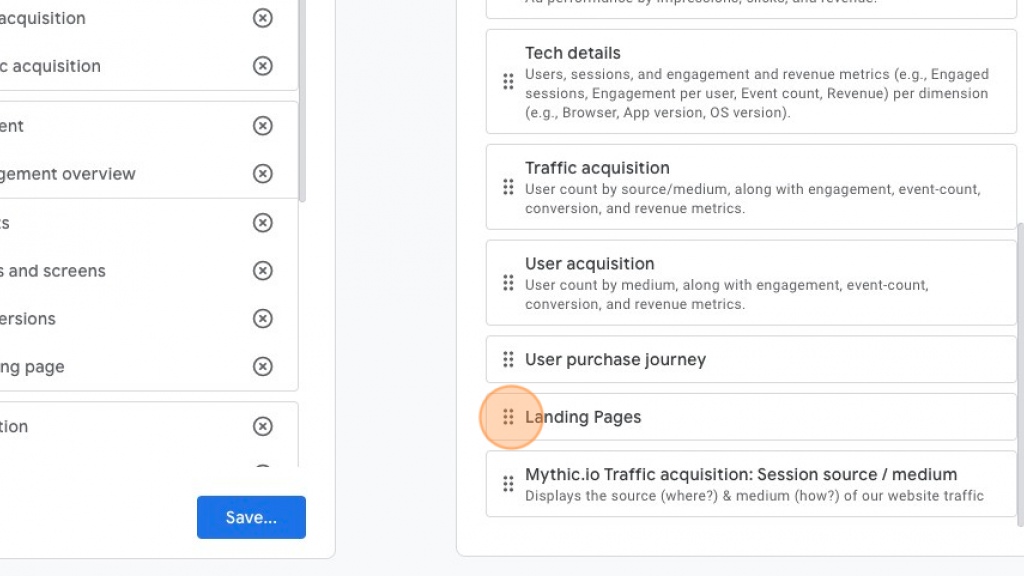
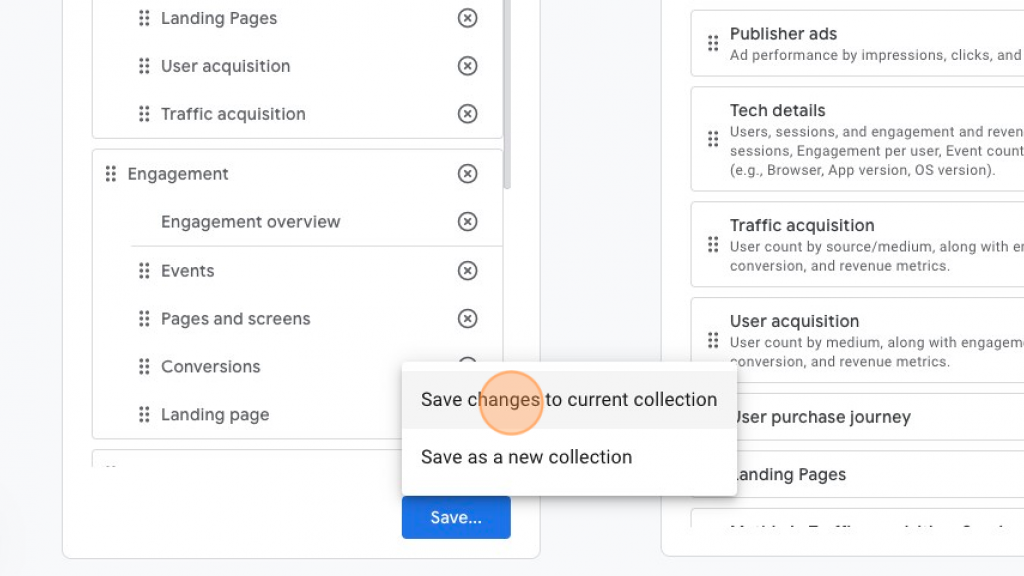
19. Click "Save."
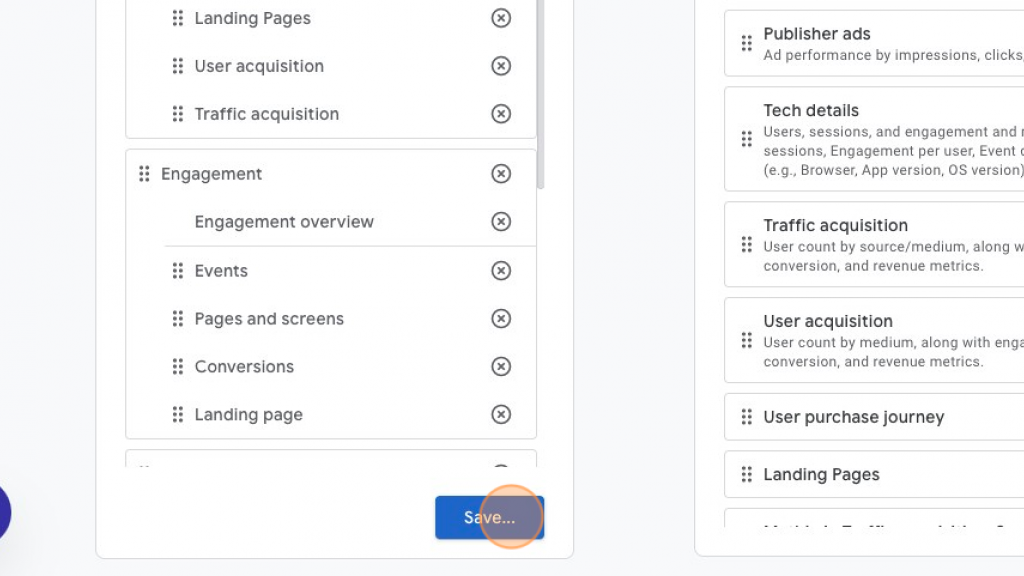
20. Click "Save changes to current collection."
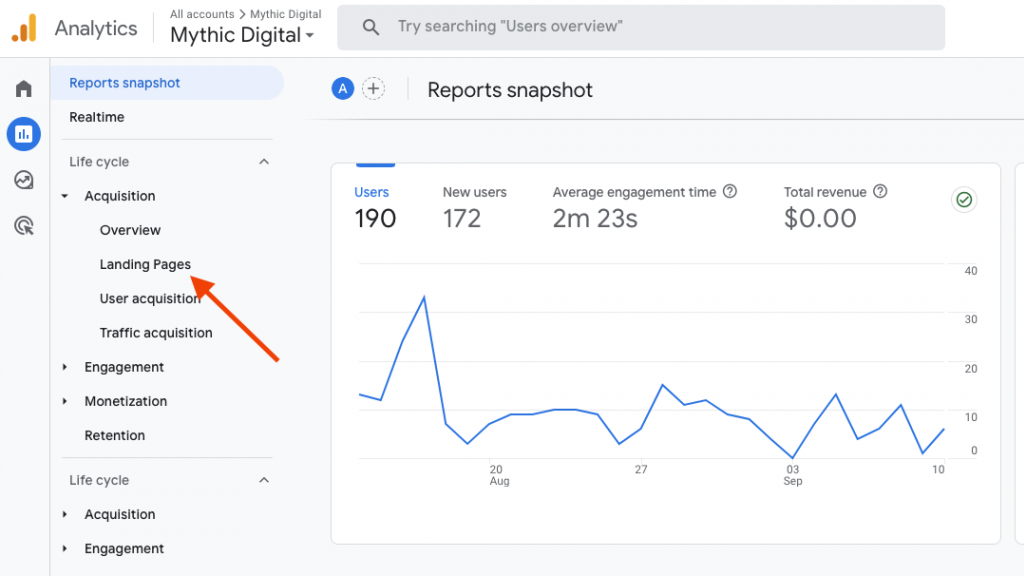
At this point you'll be able to see this new landing page report in your Left Navigation under the Life cycle collection where you saved it.
Find out which pages are introducing people to your website
Knowing which pages serve as the entry point to your website is crucial. We simply can’t understand user behavior and optimize our site for better performance without it. Google Analytics 4 offers a straightforward way to get this information through its Landing Pages Report.
Here's how to access this data.
Log in: If you haven't set up an account yet, you really should. Contact your web administrator if your company hasn’t granted you access to Google Analytics 4 tracking.
Navigate to Explore: Once you're in your Google Analytics 4 dashboard, look for the menu on the left-hand side.
Click on "Explore" to expand the options related to how users interact with your site. You’ll see options for various explorations, such as
- Free Form,
- Blank Explorations,
- Funnel Exploration,
- and even a Path Exploration feature that uses tree graphs.
Try out the different report types, showing you key metrics for each landing page, such as the number of sessions, bounce rate, and conversion rate. If needed, you can absorb more knowledge directly from Google about Explorations here. This data will help you understand which pages are most effective at drawing visitors into your website and keeping them engaged.
Understanding the performance of your landing pages is foundational, a step in making data-driven decisions synched with your business goals which you can’t miss. It allows you to identify strong and weak points in your website, enabling you to make targeted improvements.

What pages are different segments of traffic landing on?
In any industry understanding your audience is key. But remember, your audience isn't a monolith; it's made up of different segments, each with its own behaviors, preferences, and needs.
Knowing which landing pages attract these different segments can make the difference in your marketing strategy.
So, how do you find out?
Google Analytics 4 landing page reports are your go-to tool. By diving in and applying audience segments, you can see exactly where different types of traffic are landing. For example, you can segment landing page visitors by age, location, device type, or even by the source of the traffic like social media, organic search, or paid ads.
Why is this important?
Tailored Marketing Strategies
If you know that a particular landing page is popular among a specific age group, you can customize your marketing messages to resonate with that demographic.
Resource Allocation
Understanding which pages are attracting high-value segments allows you to allocate resources more effectively. Why spend time and money optimizing a page that isn't attracting your target audience?
Conversion Optimization
Different segments may have different conversion rates. By identifying these, you can optimize landing pages to better suit the needs and preferences of specific audience segments, thereby increasing conversions.
Customer Journey Mapping
Time for some landing page exploration. Knowing the entry points for different segments helps you map out more accurate customer journeys. This can guide content creation, email marketing campaigns, and even product development.
Competitive Advantage
In today's data-driven world, the more you know about your audience, the better you can serve them. And the better you serve them, the more you stand out from the competition.
So, if you're not already diving into segmented landing page metrics, now's the time to start. It's not just about collecting data; it's about making that data work for you. By understanding what pages different segments are landing on, you're taking a real step toward maximizing your web presence’s potential.
See how visitors are discovering your content
Understanding how visitors find your content is the equivalent of having cameras and microphones at your party to better grasp your guests’ behavior (with their consent, of course!).
It's not just knowing that people are visiting your website; it's about discerning the paths they took to get there. Landing page performance awareness is everything. This is invaluable information for refining your marketing strategies and making data-driven decisions.
Create a source / medium report in Google Analytics 4
Google Analytics 4 offers a variety of ways to track how visitors are discovering your content. One of the most straightforward methods is to look at the "Source/Medium" report. It tells you where your traffic is arriving from (Organic search, social, direct traffic, etc.) as well as how folks are finding you.
1. Navigate to Google Analytics.
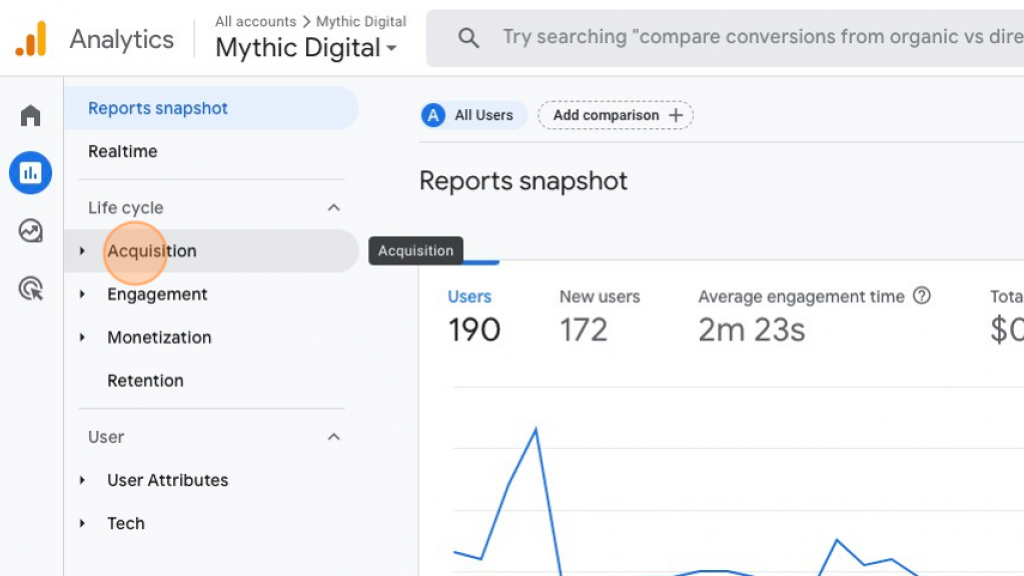
2. Click "Reports" in the left navigation
3. Choose the drop down under "Acquisition."
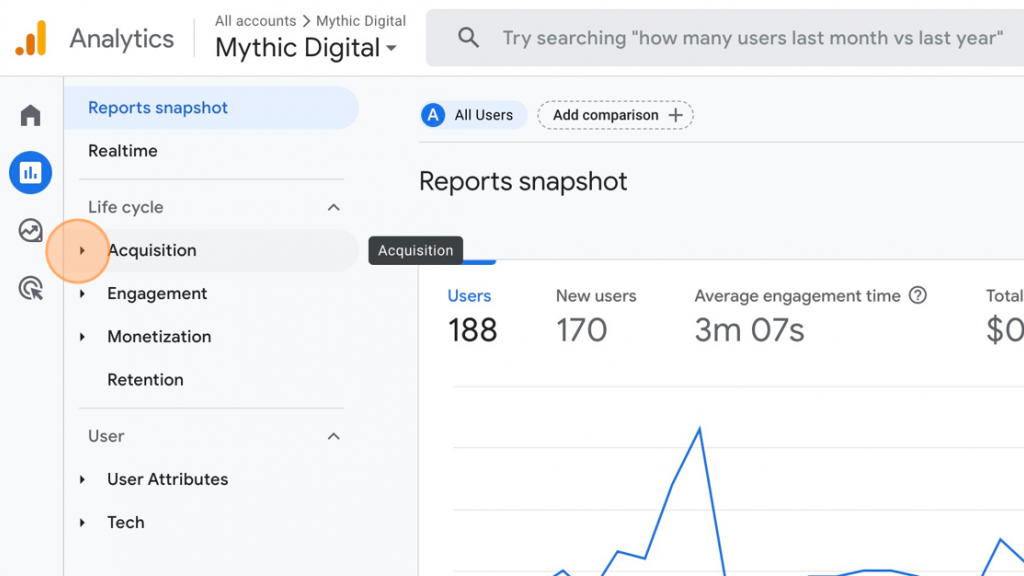
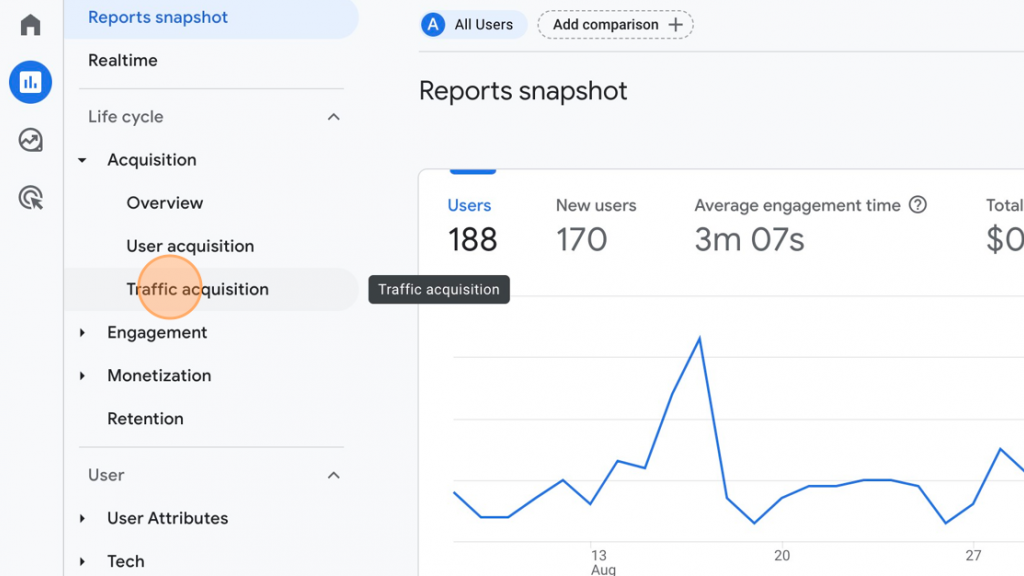
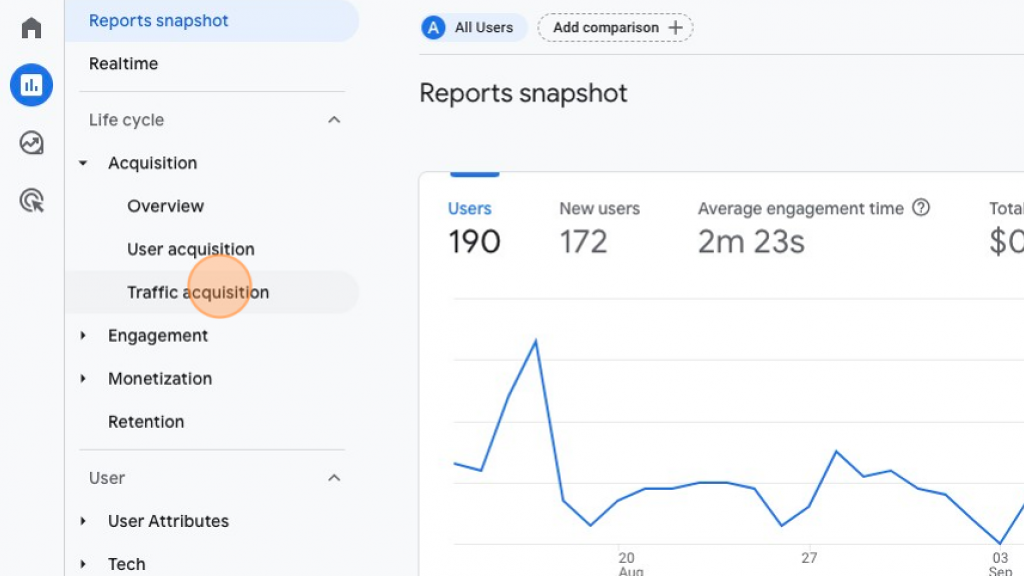
4. Click "Traffic acquisition."
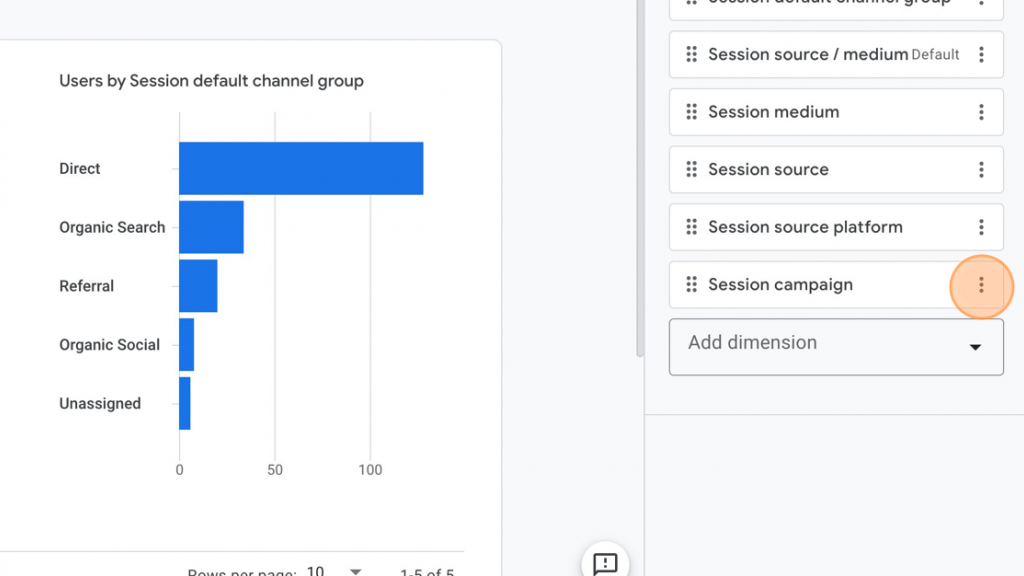
5. Look below the graph and click the dropdown next to "Session default channel group."
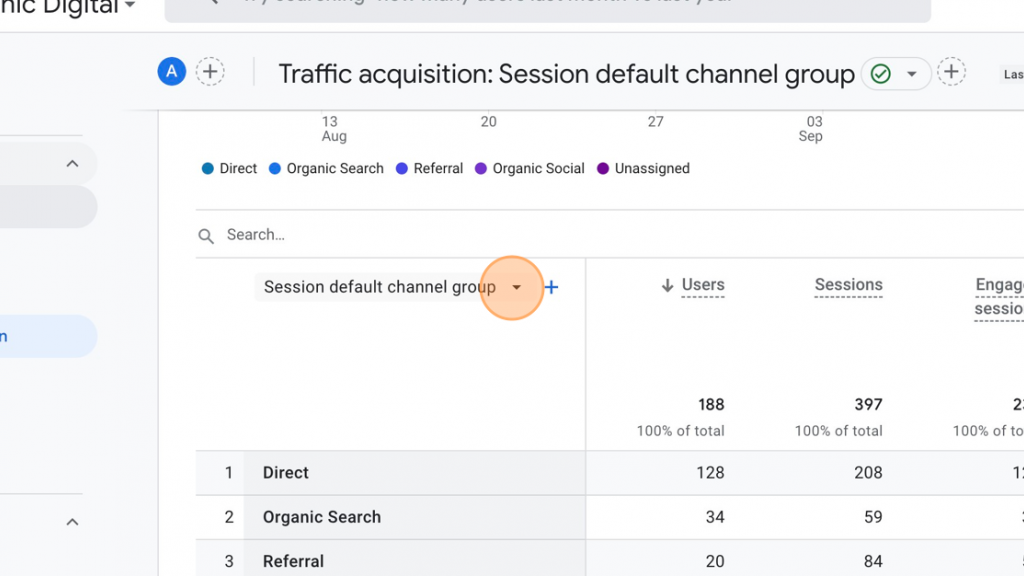
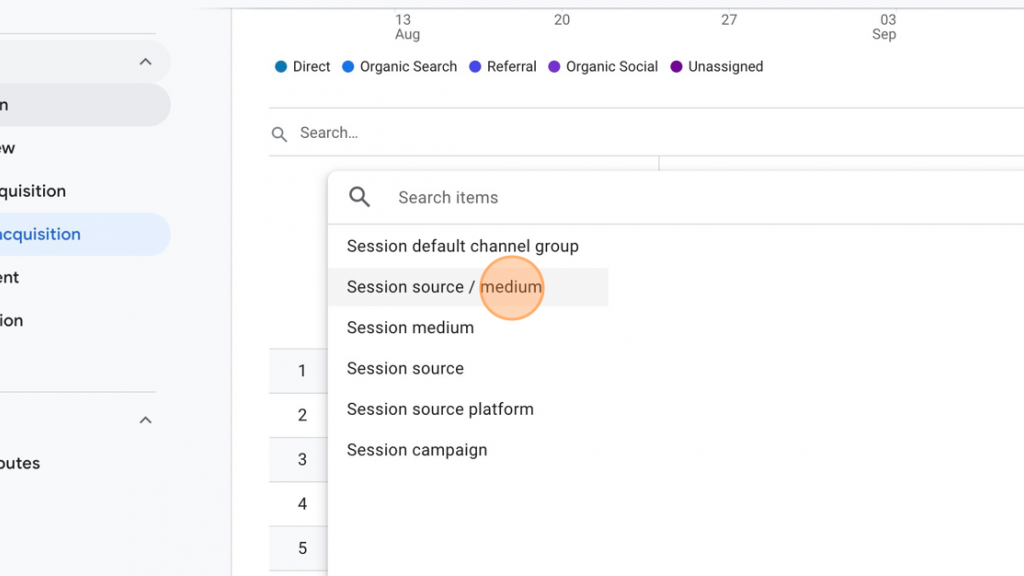
6. Click "Session source / medium" to set this as your default for this report.
7. Find the pencil icon, located top right.
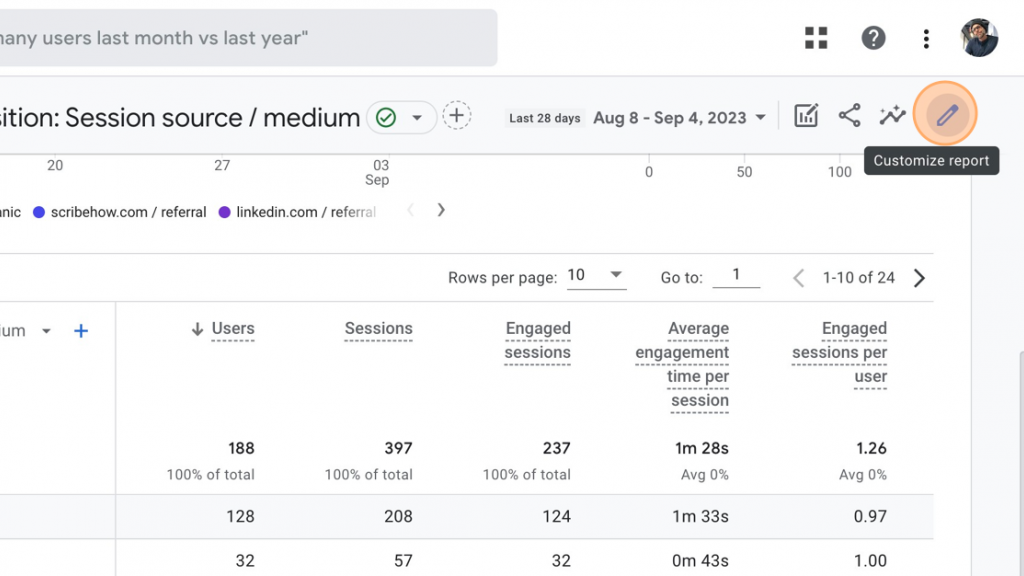
8. Click "Dimensions" to customize as needed.
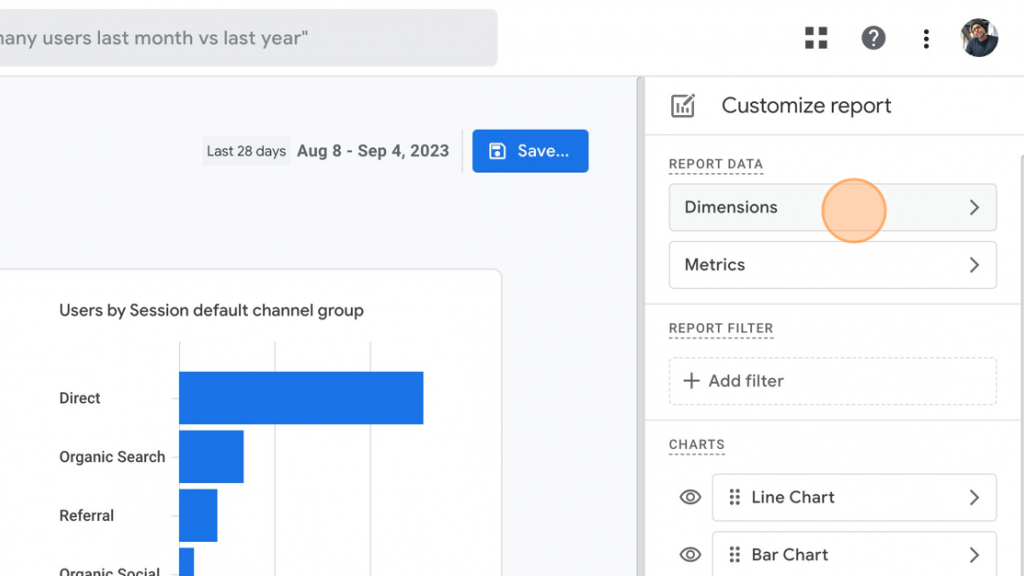
9. Click the three vertical dots next to "Session source / medium."
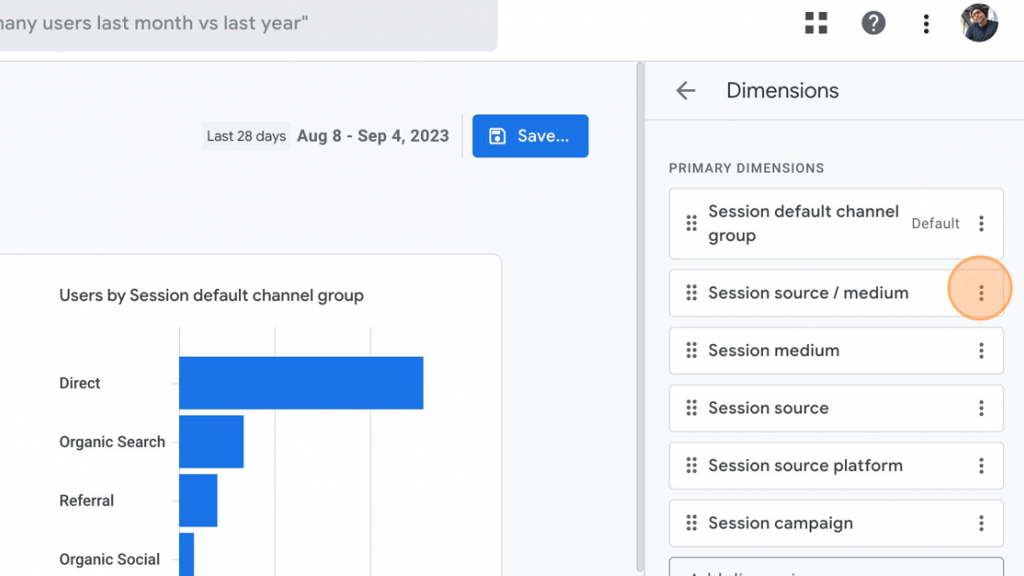
10. Choose "Set as default."
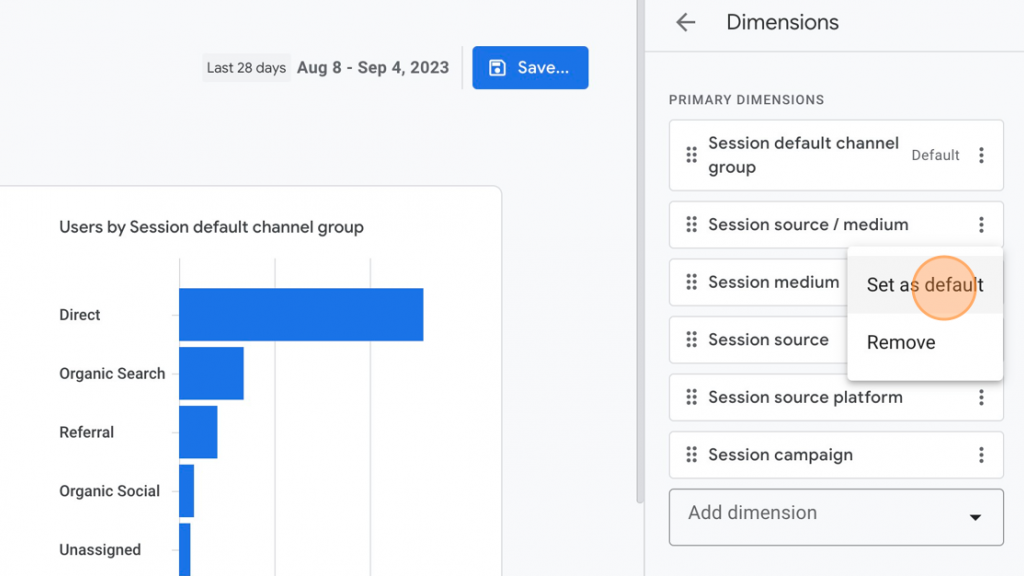
11. You can also use the vertical three dots to remove a dimension. Since Mythic doesn't currently have any running campaigns by session, let's ditch it.
12. Click "Remove."
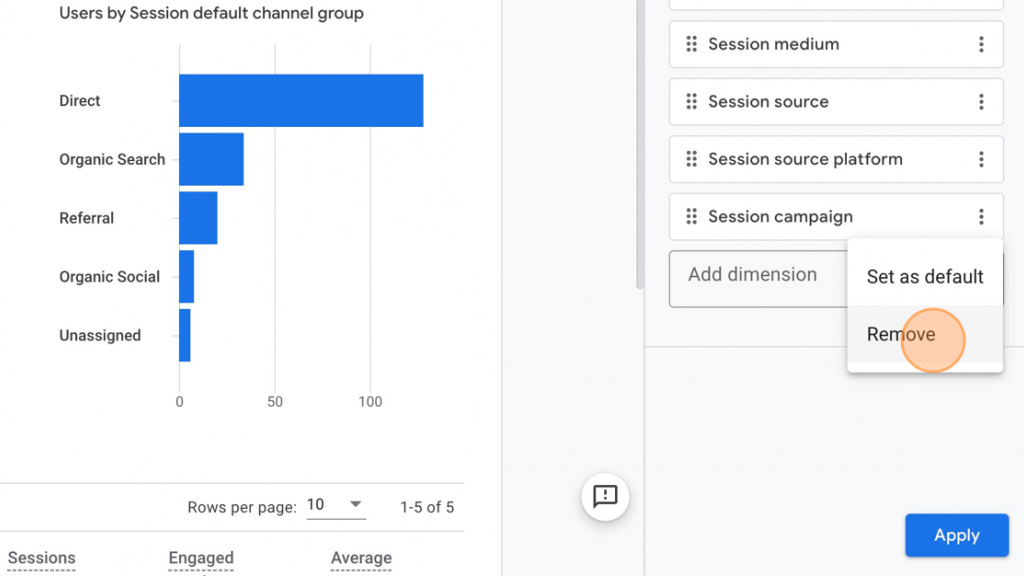
13. Click "Apply" in the bottom right.
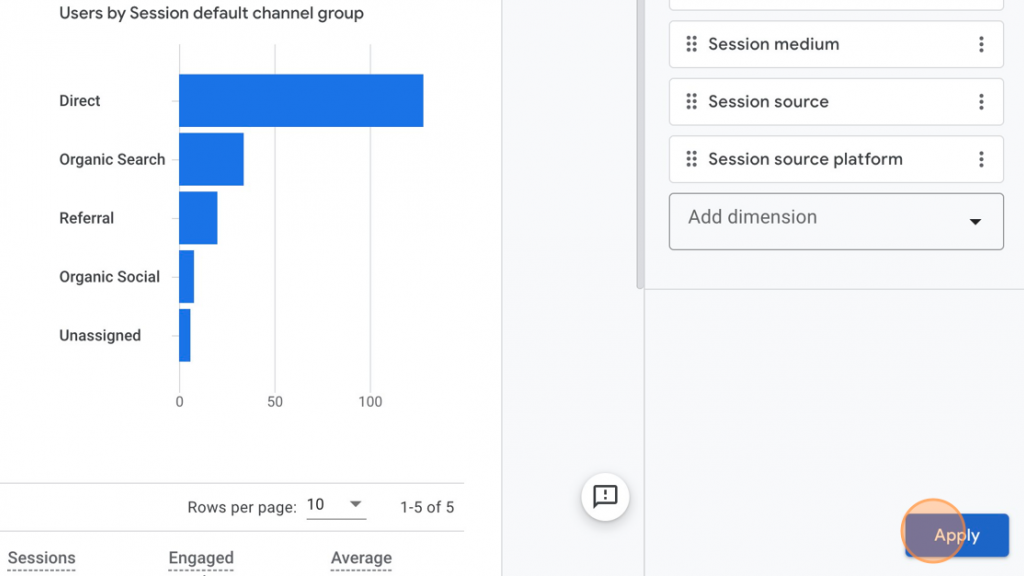
14. Click the blue Save button.
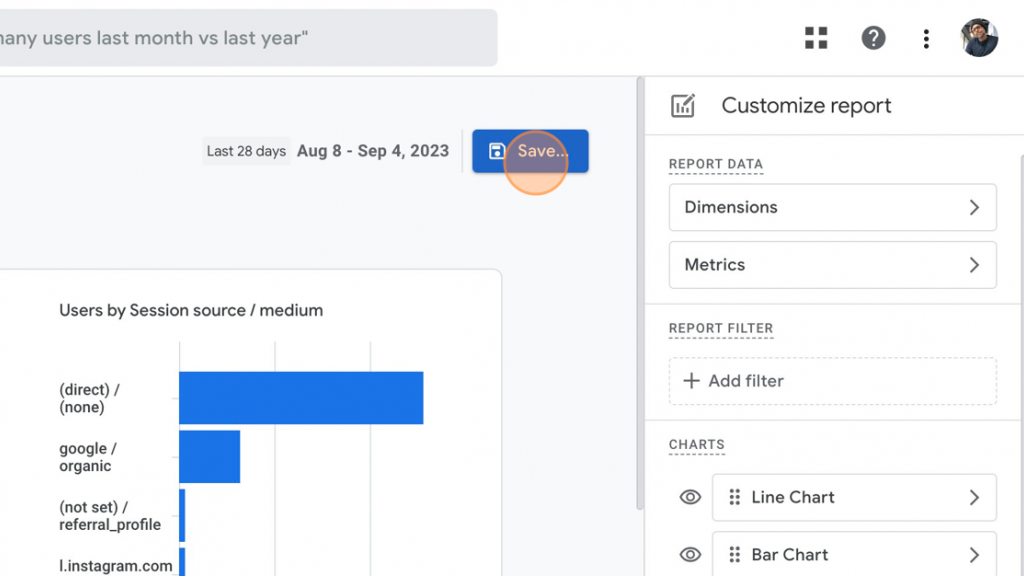
15. Click "Save as a new report."
16. Give your source / medium report a name.
17. Click "Save" and your report is complete ✔
This shows you where your traffic is coming from—be it search engines, social media platforms, or other websites. Knowing this can help identify which channels are most effective for your content and where you might need to invest more effort.
Referral report
Another useful tool is the "Referral" report, which shows other websites that are sending traffic your way. If a blog or news site is linked to your content, it'll show here. This can open doors for potential partnerships or give you insights into where your content is gaining traction outside of your immediate network.
1. Navigate to https://analytics.google.com/
2. Click "Reports."
Under Life cycle, choose "Acquisition."
Click "Traffic Acquisition."
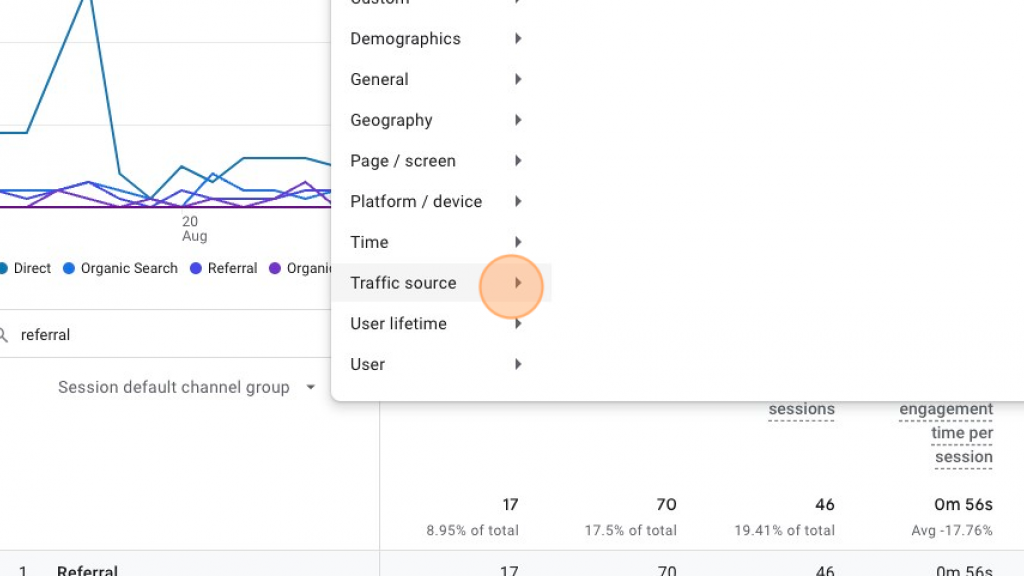
Click the search bar below above your traffic sources.
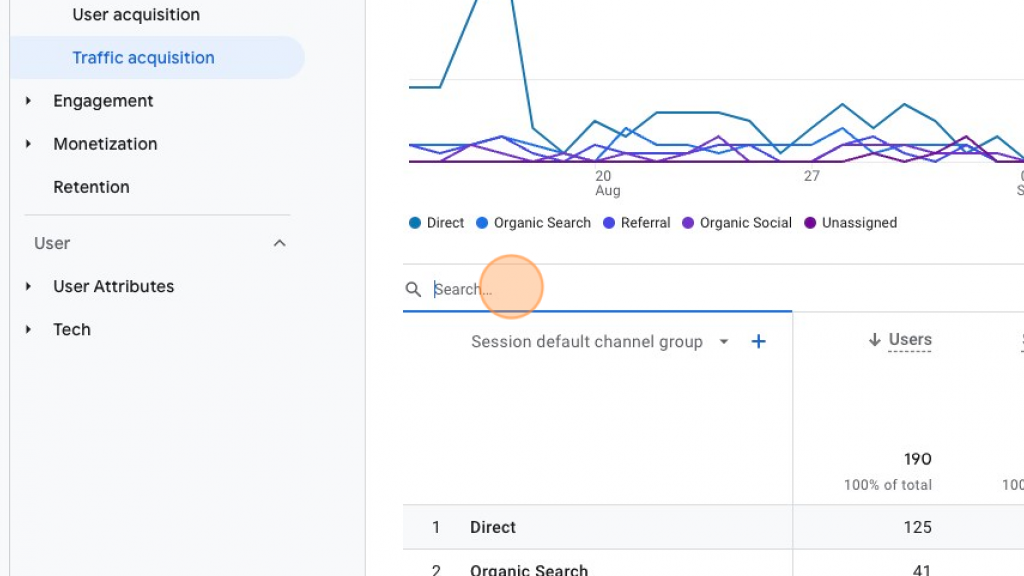
Type "referral" and choose the blue + sign.
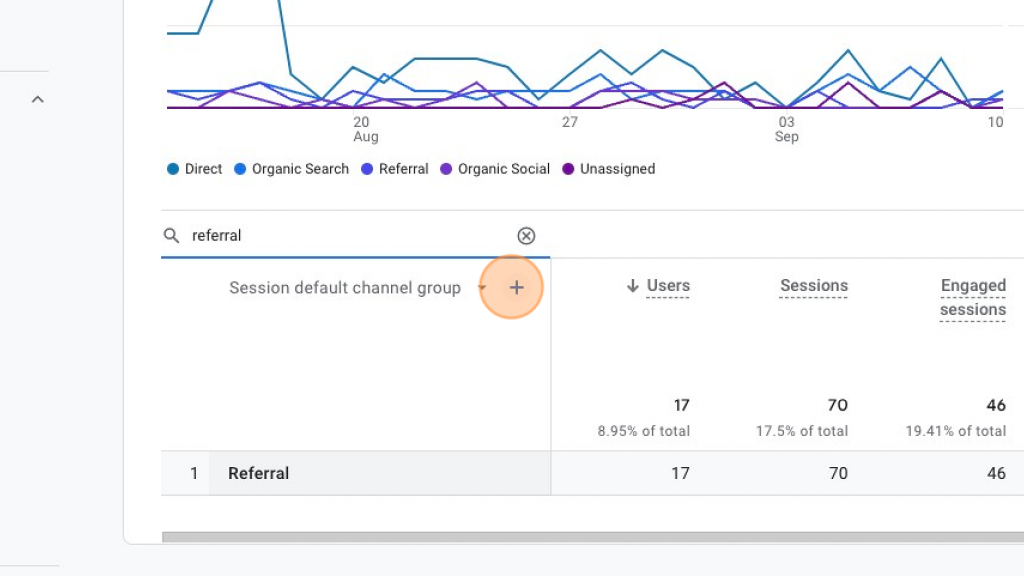
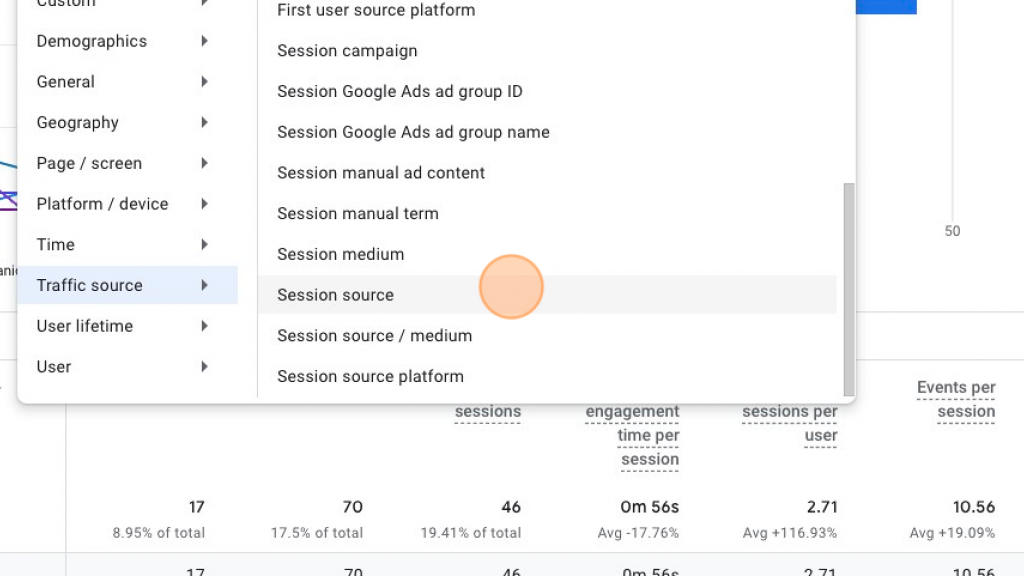
Click "Traffic source" to display a scrollable dropdown menu.
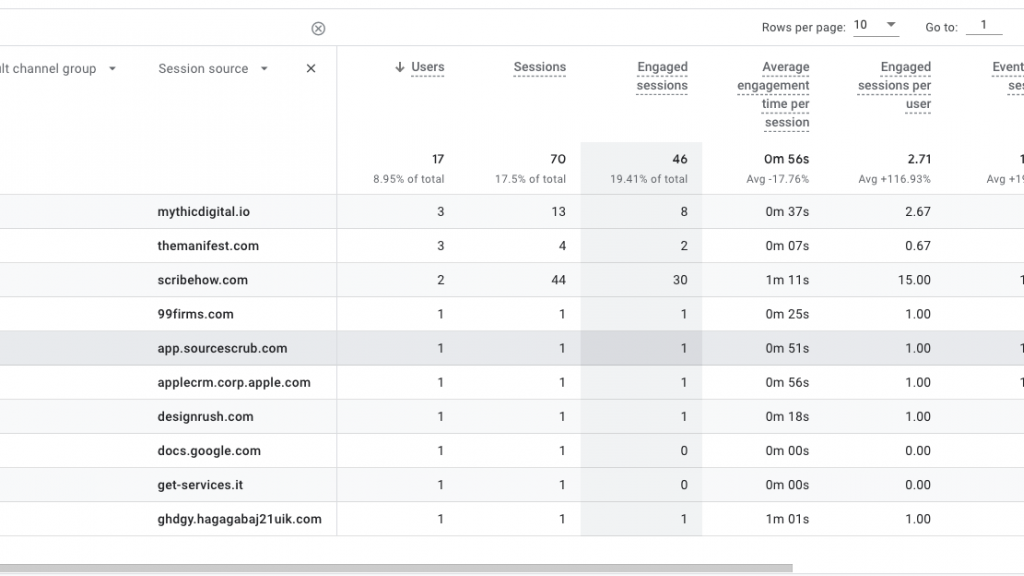
Choose "Session source."
This table will break down which other websites are sending traffic your way. It's an often overlooked, yet important feature when tracking landing pages in Google Analytics 4. If someone is linking to you, could you help them do so in an even better way? Look and what's working well and think of how to duplicate those successes elsewhere.
The possibilities are many.
Don't overlook the power of internal site search data, either. If your website has a search function, you can track what terms visitors are using to find content within your site. This can offer a wealth of information about what your audience is interested in and what they're looking to find, helping you craft future content to meet those needs.
And let's also not forget about tracking campaigns. Say you're running paid ads or email marketing campaigns. Make use of the fact that Google Analytics 4 allows you to track their performance in driving visitors to your content. You can see landing page metrics like click-through rates and conversions, giving you a clear picture of your ROI.
In essence, seeing how visitors discover your content isn't just a 'nice-to-have.' It's essential for any marketer or manager aiming for success.
These insights provide a clearer understanding of your audience, helps you allocate resources more wisely towards a higher conversion rate, and fine-tunes your overall strategy. So, if you're not already digging into landing page performance, it's high time you start.
After all, the more you know, the better equipped you are to create something that truly resonates with your audience.
Bounce rate
Imagine your doorman greets guests as they arrive at your party. Some guests walk in, take a quick look around, and then immediately leave without even grabbing a drink or saying hello. So rude!
In Google Analytics 4, this behavior is what we call a "bounce." The bounce rate is the percentage of visitors who land on your page and then leave without interacting further—no clicking on links, no filling out forms, nada.
Now, why should you care about the bounce rate? Well, a high bounce rate could be the digital equivalent of guests walking into your party and then promptly exiting. It's a sign that something might be off. Maybe they didn't like the vibe, found the content irrelevant, or had a hard time navigating your page.;

Whatever the reason, a high bounce rate is a signal that there's room for improvement.
However, context (as usual) is key. A high bounce rate isn't always bad. For example, if the landing page provides all the necessary information and the visitor leaves satisfied, that's not necessarily a failure.
But generally, you want to aim for a lower bounce rate, which would indicate that visitors are engaging more deeply with your site. They're not just stepping into the foyer; they're exploring the rooms, enjoying the snacks, and having conversations. In digital terms, they're clicking through to other pages, filling out forms, or making purchases.
So, when you're looking at your landing page reports, pay special attention to the bounce rate. It's a metric that can offer valuable insights into user behavior and the effectiveness of your landing pages. Think of it as feedback from your doorman about how inviting your party really is and what you can do to keep the guests mingling (and returning again). 🎉
What is a good average time on page for a website?
When you want to understand the effectiveness of your landing pages, "Average Time on Page" is a metric that can offer helpful insights. But what constitutes a "good" average time on page can be a bit of a moving target, depending largely on the type of content you're offering and what you want visitors to do on that page.
For instance, if you have a long-form blog post that's meant to educate your audience on a complex topic, a longer average time on page—say, several minutes—could indicate that visitors are engaging deeply with your content.
On the other hand, if your landing page is designed for quick conversions, like signing up for a newsletter, a shorter average time might actually be a good sign. It could mean that visitors are quickly finding what they need and taking action.
It's also crucial to consider the industry you're in and the type of audience you're targeting. A tech-savvy audience might navigate your site more quickly, while an older demographic might take more time to explore. Industry benchmarks can provide some context here, helping you understand what a "good" average time on page looks like for businesses similar to yours.
In summary, there's no one-size-fits-all answer to what a good average time on page should be. It's a metric that needs to be interpreted in the context of your specific goals, content type, and audience.
For those looking for a quick answer, Databox gives us an average for the SaaS and Tech industries of 1 minute, 46 seconds. Again, there are many factors to consider here but this should give you a basic idea.
By understanding this, you can more actively tailor your landing pages to meet the needs and expectations of your visitors, setting the stage for better engagement and higher conversions.
Conclusion
Creating landing page reports in Google Analytics 4 isn't just another task to check off your to-do list. It's more of a strategy for understanding your audience and optimizing your website's performance.
From identifying which pages serve as the entry point to your digital world to digging into the diverse segments of your audience, these reports will give you a ton of actionable insights.
We've explored key metrics like sessions, bounce rate, and conversion rate, each offering its own set of clues about user behavior. And remember, in the Google Analytics 4 universe, a landing page isn't just a marketing-specific page; it could be your homepage, a blog post, or even an error page.
Each has its own story to tell and its own role in your overall strategy.
So, whether you're a creative looking to tailor your campaigns or a manager aiming to allocate resources more effectively, landing page reports are your go-to resource. They're the doorman at your digital party, giving you the lowdown on who's coming in, who's sticking around, and who's heading for the exit.
For me, this is one of those opportunities to make my work and play feel more alike. By diving deep into the data, it helps to sort of gamify the whole process.
The more I know my audience the higher my “understanding score” climbs, and the better equipped I am to create something truly magical for them. My hope is that you'll feel something similar. Happy analyzing! 📊